Scatter diagrams and stratification are two of the seven quality control tools utilized for data analysis. These tools assist in identifying the cause-and-effect relationships of any issues based on the results of the analysis. In this post basic overview of scatter diagram & stratification is explained, which is easy to understand.
Let’s understand these tools one by one.
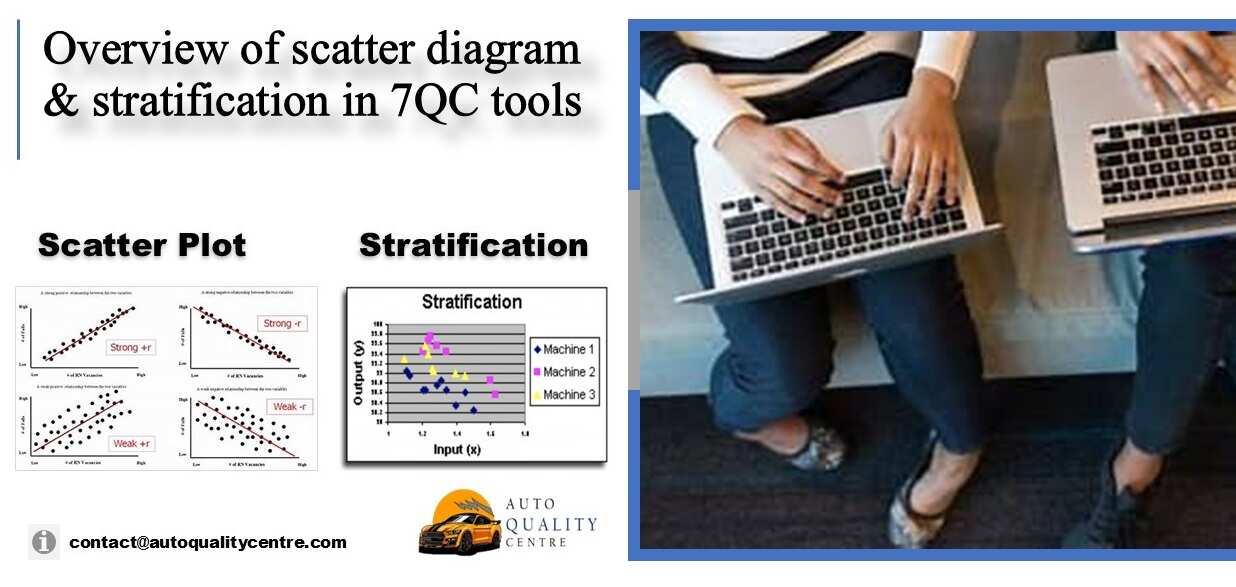
Overview of scatter Diagram
A scatter diagram is a tool utilized to examine the potential relationship between two sets of variables. It is also referred to as a correlation chart, scatter plot, or scatter graph. This diagram displays pairs of numerical data, with one variable represented on the horizontal axis and the other on the vertical axis, in order to identify any relationship between them.
When variables are correlated, the data points will align along a line or curve. The stronger the correlation, the closer the points will be to this line. A scatter diagram is employed to investigate hypotheses regarding cause-and-effect relationships, specifically to ascertain if one variable is responsible for the failure of another.
This diagram is especially beneficial after creating a fishbone diagram, as it allows for an objective assessment of the relationship between cause and effect. Additionally, the values of the variables must be numeric in order to construct a scatter plot.
Key features of Scatter Diagram
- Data Points: Each point represents one observation with two numeric values.
- X and Y Axes: The horizontal axis typically represents the independent variable, while the vertical axis shows the dependent variable.
- Trend Indicators: Patterns in the plot may suggest positive, negative, or no correlation.
- Clusters and Outliers: Groups of points or isolated ones can reveal subgroups or anomalies.
Initially introduced by Sir Francis Galton in 1888 to examine the correlation between individuals’ heights and their forearm lengths, he was a cousin of Charles Darwin, renowned for his theory of evolution. Francis Galton was a British mathematician and statistician.
When to use scatter diagram?
There are 3 reason you might use scatter plot for data analysis:
- When we need to identified pattern & correlation in data
- Demonstration of relationship between two variables
- Identifying correlation by line of best fit in plot
What is correlation in scatter diagram?
Correlation talks about degree or relationship between two variables. Correlation means how the points are scattered over the chart,
- More the points plotted are scattered over the chart, lesser the degree of correlation between variable.
- More the point plotted are closer to the line, higher the degree of correlation.
With correlation try to look for relationship and not cause and effect. If relation is positive, then there could be cause and effect study. It is denoted by “R” – Correlation Cofficient.
Properties of correlation coefficient
- R>0 – Positive correlation
- R<0 – Negative correlation
The value of R varies between 1 & -1. Indicating correlation is significant. ‘R’ can be calculate by formula using excel. Here R is calculated when we are not sure about the result of plot coming on scatter diagram, whether this relationship is significant or not.
Types of correlation in scatter diagram
- Positive correlation
- Negative correlation
- Complex correlation
- No correlation
Positive correlation:- Value of one variable increases as value of another variable increase. It can further be classified as weak positive correlation (One variable increase slightly as another increases).
Negative correlation: – Value of one variable decreases as the value of another variable increases. Same classification for negative correlation – Weak negative correlation (One variable slightly decreases as another variable increases.
Complex correlation: – The value of one variable seems to be related to the value of another variable, but the relationship is not easily determined.
No correlation: – There is no demonstrated relation between both variables.

Example of Positive & negative correlation in scatter diagram
- Height & weight of people – Positive
- Vehicle speed & accident on road – Positive
- Overeating & weight of people- Positive
- Moisture content & elongation of thread- Positive
- RH & LH side focus of head light- Positive
- Employee moral & customer complaint- Negative
- Ambient temp & food life – Negative
- Level of cleanliness & no of infection- Negative
- Training hours of employee & error in his work- Negative

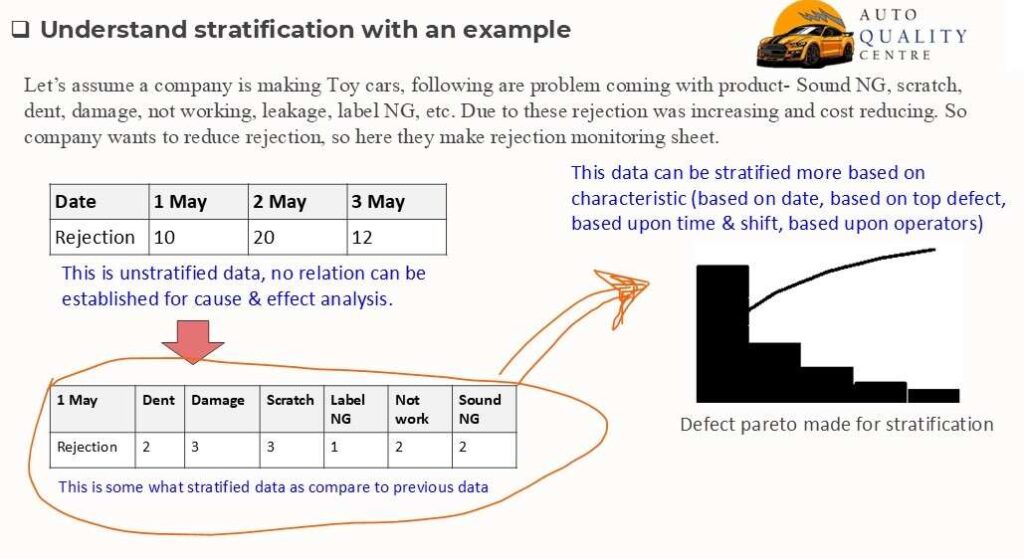
Overview of stratification in 7QC tools
Stratification is one of the tool of 7QC tools, it helps to identified pattern in large amount of data. It is the process of segregating or regrouping the data on the basis of certain characteristics for identifying the influence factors.
It works by dividing a population by homogenous subgroups or breaking down large population into small group of same nature. When data from a variety of source gets lumped together, it loses its meaning and purpose. Here stratification separates the data so that pattern can be seen clearly.
Tools used for stratification- Excel, Minitab & Python.
Procedure of stratification
Before collecting data, you should know what information about the sources of the data can have an effect on the results. What are we going to analyze?
- First Collect the data.
- Determine the stratification factors to be selected.
- Make the necessary calculations to divide the strata.
- Graph the collected data in a scatter diagram, control chart, histogram or other analysis tool. Use different brands or colors to distinguish data from various sources.
- Observe and analyze the results.
Benefits of stratification
- Separate Data into groups. Enhance clarity
- Draw meaningful and correct inferences from the data. Focus decision making
- Diagnose and Localize problems i.e. establish clear relationship between cause and effect.
- Identify the influencing factors, thereby making it easier to solve the problems. Improve decision making.
Common stratification factors
- Time: Days, weeks, seasons, or shifts
- Location: Branches, regions, departments
- Demographics: Age, gender, income level
- Processes or Products: Machine types, product lines, service categories
- Employee or Staff Roles: Job titles, experience levels, teams
Conclusion
Scatter diagram is tool to find correlation between two variable factors. With this tool we tried to catch the relationship between two variable factors. Plot of value show result of correlation. While stratification is also one of the 7QC tools which is used to stratified a large number of data into small subgroup data of similar charateristics.
Hope you like this post and found this helpful. All comment and suggestion are welcome. Write your feedback- contact@autoqualitycentre.com
You may also like following posts:
What are 5S, 3M, 3G & 3K in Industries?
Poka Yoke & its basic functions


Pingback: Engineering drawing and its various projections
Pingback: Guide to implement Quality circle in Organization - AQC